
India Stock Market Weekly Analysis: September 18–24, 2026
India Stock Market Weekly Analysis: September 18–24, 2026India Stock Market Weekly Report period: September 18–24, 2026
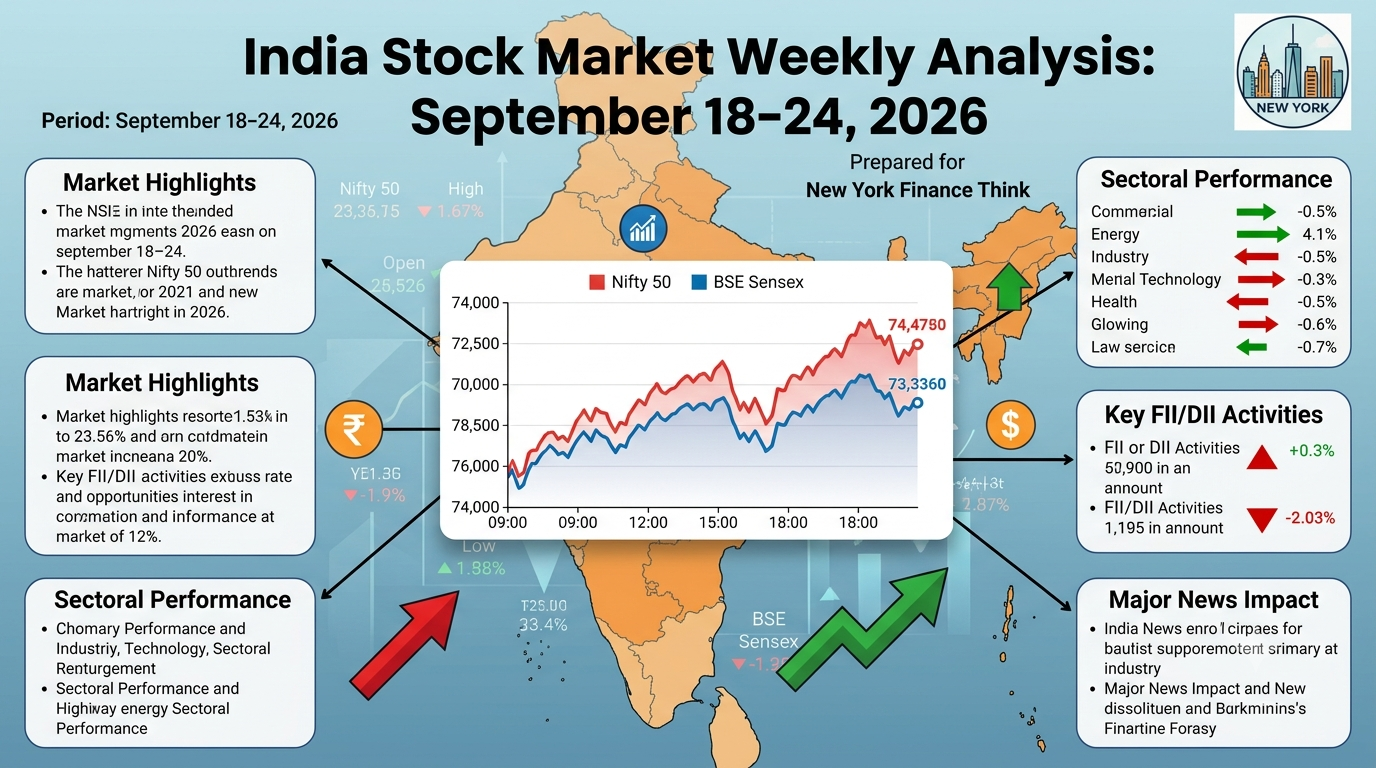
Prepared for New York Finance Think indian equities entered the final trading session of the week under renewed pressure after a brief recovery on September 21 and 23.The Nifty 50 closed at 23,346.40 on September 18, rose to 23,414.30 on September 21, slipped to 23,329 on September 22, and recovered to 23,446.80 on September 23. By around 2:30 PM IST on September 24, however, the index had fallen to approximately 23,071.40, while the Sensex was around 73,620, down about 1.61% at that time.One-Week Market Data date| Nifty 50| Daily Move| Sensex| Market Trends ep 18| 23,346.40| +0.33%| 74,294.96| Mild Recovery sep 21| 23,414.30| +0.29%| 74,858.99| PositiveSep 22| 23,329.00| -0.36%| 74,529.08| WeakSep 23| 23,446.80| +0.50%| 74,828.25| RecoverySep 24*| ~23,071.40| ~-1.60%| ~73,620| Sharp selloff*September 24 is an intraday reading around 2:30 PM IST, not the final closing price.What Happened During the Week?The week started with some buying interest after Indian equities had already experienced a prolonged period of weakness.On September 18, the Nifty gained 0.33%, but the weekly performance remained negative. Reuters reported that the Nifty had declined 0.22% for the week ending September 18, while the Sensex fell 0.65%, marking the sixth consecutive weekly decline.September 21 brought a modest recovery. The Nifty rose 0.29% to 23,414.30 and the Sensex gained 0.76% to 74,858.99 as lower crude prices and bargain buying supported sentiment.The recovery did not continue smoothly.On September 22, the Nifty fell 0.36% and the Sensex declined 0.44%. IT stocks were among the areas under pressure, while investors continued to monitor crude oil, foreign fund flows and geopolitical developments.On September 23, the market recovered again. The Nifty closed at 23,446.80, up 0.50%, while the Sensex gained 0.40% to 74,828.25. Market breadth was positive and India VIX declined to around 10.3.Then came a sharp reversal on September 24.September 24 Selloff Changes the Weekly PictureThe September 24 session has been the most important move of the week so far.At around 2:30 PM IST, the Nifty was down about 1.60% at 23,071.40, while the Sensex had fallen around 1.61% to 73,620.33.Selling was broad-based. The Nifty Midcap 100 was down around 2.08%, while the Nifty Smallcap 100 was lower by about 1.53% at that point.Earlier in the session, NSE data showed only 8 Nifty 50 stocks advancing against 42 declining, demonstrating the breadth of the selling pressure.Why Is the Market Under Pressure?1. U.S. Treasury YieldsGlobal bond markets remain one of the biggest external factors for Indian equities.The U.S. 10-year Treasury yield moved above 5.1%, according to market reports, creating additional pressure on emerging-market equities.Higher U.S. yields can make dollar-denominated assets relatively more attractive and can influence global capital allocation.2. Crude OilCrude oil remains a major issue for India.Brent crude had moved back above $100 per barrel during the period, with Middle East tensions contributing to price volatility. Reuters also linked recent Indian market pressure to oil prices and geopolitical uncertainty.For India, sustained high crude prices matter because the country imports a large amount of its oil.Higher oil prices can increase the import bill and create pressure on inflation and the rupee.3. Foreign Investor FlowsForeign investor activity remains an important market variable.When global yields rise and geopolitical uncertainty increases, emerging-market equities can face pressure from foreign portfolio flows.Domestic institutional buying can partially absorb that selling, but the balance between foreign and domestic flows remains important for the near-term market direction.4. Global Geopolitical RiskThe Middle East continues to influence oil prices and global risk sentiment.Markets are particularly sensitive to developments that could affect energy supply or transportation routes.This is one reason crude oil has remained a major variable for Indian equities throughout the week.Sector PerformanceBanking and FinancialsFinancial stocks have been an important source of volatility.On September 24, financial stocks were among the areas facing heavy selling pressure. Nifty Bank was reported to be down around 1.6% during the morning session.Because banks have significant weight in India’s major indexes, weakness in the sector can quickly affect the Nifty and Sensex.Information TechnologyIT stocks were under pressure earlier in the week.On September 22, the Nifty IT index declined about 0.9%, with concerns surrounding demand and earnings expectations weighing on sentiment.EnergyEnergy stocks have received mixed signals.Higher crude prices can benefit some upstream producers, but they can increase costs for businesses that consume fuel and petroleum-based inputs.InsuranceInsurance was one of the relatively stronger areas during the previous week’s market action.Reuters reported gains in HDFC Life and SBI Life during the week ending September 18, supported by investor interest in the sector’s growth outlook and changes in financial reporting.Broader MarketThe weakness on September 24 has not been limited to large-cap stocks.At around 2:30 PM:- Nifty 50: -1.60%- Nifty Midcap 100: -2.08%- Nifty Smallcap 100: -1.53%This indicates that selling pressure had spread into the broader market.The broader-market performance is important because it shows whether market weakness is concentrated in index heavyweights or affecting a much wider group of stocks.One-Week Market StructureThe week’s movement can be divided into three stages:Stage 1 — Recovery:September 18–21 saw bargain buying and some improvement in sentiment.Stage 2 — Consolidation:September 22–23 produced mixed trading, with the Nifty moving between roughly 23,329 and 23,447.Stage 3 — Renewed Selling:September 24 brought a sharp decline, taking the Nifty below 23,100 intraday.This pattern shows that the recovery attempts have not yet produced a sustained upward move.Important Nifty LevelsSupportThe 23,000–23,100 area has become an important short-term zone after the September 24 decline.A sustained move below this region would put additional attention on lower support levels.ResistanceThe 23,400–23,500 area is an important near-term resistance region because the index traded around this zone during September 18–23.A sustained recovery above this area would indicate that buyers are regaining some control.These are market reference levels, not guaranteed turning points.India VIXIndia VIX was relatively subdued on September 23, ending around 10.3 after falling roughly 6%.The sharp market decline on September 24, however, highlights why volatility indicators need to be considered alongside actual price movement and market breadth.The Bigger Economic PictureMarket performance is being influenced not only by stock-specific developments but also by India’s broader economic conditions.Data reported for the week ending September 18 showed India’s August CPI inflation at 4.82%, up from 4.45% in July, while WPI inflation rose to 9.92% from 9.78%.At the same time, India’s merchandise exports rose 26.11% year over year in August to $43.81 billion, while imports increased 14.06% to $70.67 billion.These numbers show a mixed macroeconomic picture: economic activity and exports remain significant positives, while inflation and imported energy costs remain areas investors are watching.What Investors Will Watch NextThe next trading sessions are likely to focus on:1. Nifty 23,000–23,100 support2. 23,400–23,500 resistance3. Crude oil prices4. U.S. 10-year Treasury yield5. Indian rupee6. FII and DII flows7. Banking-sector performance8. IT-sector earnings expectations9. Middle East developments10. Global equity-market directionWeekly ConclusionThe Indian stock market has experienced a volatile week.The Nifty initially found some support after a prolonged period of weakness, but the sharp September 24 decline has again placed the benchmark under pressure.The key external risks remain crude oil, U.S. Treasury yields and geopolitical uncertainty.The domestic economy continues to provide important support through economic activity, exports and institutional liquidity, but short-term market performance remains highly sensitive to global conditions.The most important development now is whether the Nifty can stabilize around the 23,000–23,100 area or whether selling pressure continues.For investors and market observers, the coming sessions will provide a clearer indication of whether the latest decline is another short-term correction or part of a broader continuation of the market’s recent weakness.—Weekly Market SummaryFactor| Current ReadingNifty 50| Under pressureSensex| Under pressureMarket Breadth| Negative on Sep 24Banking| WeakIT| Weak earlier in weekCrude Oil| Major risk factorU.S. Treasury Yields| ElevatedIndia VIX| Low before Sep 24 selloffForeign Flows| Important market driverShort-Term Volatility| ElevatedAuthor: Dr. Abhishek BhattNew York Finance ThinkDisclaimerThis report is for informational and educational purposes only. It is not investment advice or a recommendation to buy or sell any stock, index, ETF or other security. September 24 figures marked as intraday are not final closing values. Investors should verify live market data and conduct their own research before making financial decisions.
