
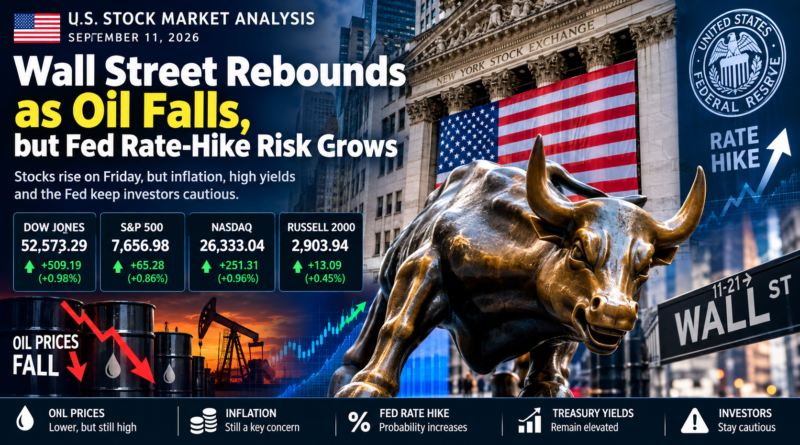
U.S. STOCK MARKET SEPTEMBER 11, 2026: WALL STREET’S POWERFUL REBOUND AS OIL FALLS, BUT FED RATE RISK SURGES
September 11, 2026
U.S. STOCK MARKET ANALYSIS
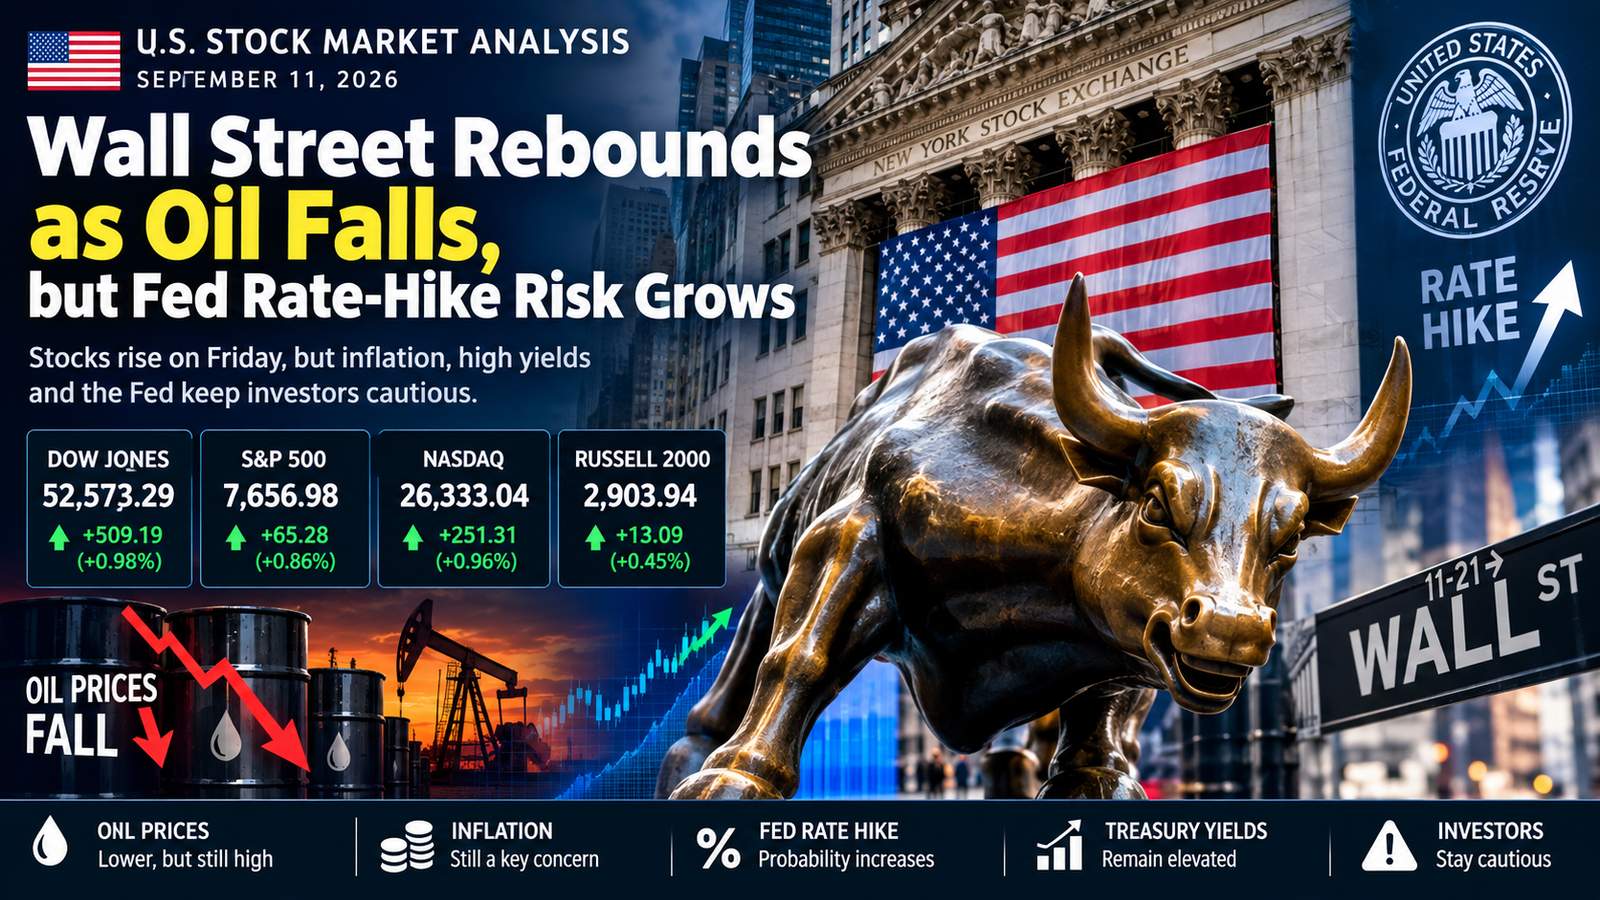
Wall Street finally got a break on Friday, September 11, 2026.
After four straight losing sessions, U.S. stocks turned higher as falling crude oil prices reduced some of the inflation pressure that had been hurting stocks and bonds during the week.
The Dow Jones Industrial Average gained 0.98%, the S&P 500 rose 0.86%, the Nasdaq Composite advanced 0.96%, and the Russell 2000 increased 0.45%.
But Friday’s rally did not erase the bigger concerns facing investors.
The U.S. inflation report was still uncomfortable. August consumer prices increased 3.4% from a year earlier, while core inflation remained above the Federal Reserve’s 2% target. At the same time, Treasury yields remained elevated and markets dramatically increased expectations for a Federal Reserve interest-rate hike at the September policy meeting.
That created an unusual situation for Wall Street.

Stocks went up even as investors became more confident that the Federal Reserve could raise interest rates.
The reason was simple: oil prices fell sharply.
Lower oil prices gave investors hope that the latest inflation shock may not become a long-lasting problem.
The question now is whether Friday’s rebound is the beginning of a new move higher or simply a temporary recovery inside a more difficult market.
MARKET SNAPSHOT: SEPTEMBER 11, 2026
| U.S. Market | September 11 Close | Daily Change |
|---|---|---|
| Dow Jones Industrial Average | 52,573.29 | +509.19 (+0.98%) |
| S&P 500 | 7,656.98 | +65.28 (+0.86%) |
| Nasdaq Composite | 26,333.04 | +251.31 (+0.96%) |
| Russell 2000 | 2,903.94 | +0.45% |
| VIX | 15.84 | -11.21% |
| Brent Crude | $104.67 | -2.75% |
| WTI Crude | $100.25 | -2.18% |
The major indexes all finished higher, ending a four-session losing streak. The S&P 500 gained 0.86%, while the Dow and Nasdaq each gained close to 1%.
CAPTION
September 11, 2026 market close: U.S. stocks rebounded as crude oil prices declined, although inflation and Federal Reserve rate risks remained major concerns.
WHY DID THE U.S. STOCK MARKET RISE?
Friday’s rally had several important drivers.
The biggest was crude oil.
Oil prices had become one of the biggest threats to the stock market during the week. Higher oil prices increase transportation costs, fuel costs and production expenses. They can also push consumer inflation higher.
On Friday, however, crude oil prices moved lower.
Brent crude fell about 2.75% to approximately $104.67 a barrel, while WTI crude declined about 2.18% to around $100.25.
That was important because investors were already worried about inflation.
A decline in oil prices offered Wall Street a temporary escape from that pressure.
The market effectively received this message:
Oil is still expensive, but today’s direction is better.
That was enough to help technology stocks recover and push the major indexes higher.
Reuters reported that nine of the 11 major S&P 500 sector indexes finished higher, with communication services and consumer discretionary among the leaders.
THE FOUR-DAY LOSING STREAK IS OVER
Friday’s rally ended a painful four-session losing streak for U.S. stocks.
That was psychologically important.
Markets had spent much of the week dealing with:
- Rising oil prices
- Higher Treasury yields
- Inflation concerns
- Federal Reserve uncertainty
- Geopolitical risks
- Pressure on technology stocks
- Weakness in small-cap stocks
Thursday had been particularly difficult.
The S&P 500 dropped 0.58%, the Nasdaq declined 0.64%, and the Dow fell 0.60% as oil prices surged and Treasury yields moved higher.
Friday reversed much of that short-term damage.
But investors should remember one important fact:
The week was still negative.
THE WEEKLY SCORECARD TELLS A DIFFERENT STORY
Friday looked bullish.
The full week looked much more cautious.
| Index | Weekly Performance |
|---|---|
| S&P 500 | -0.8% |
| Dow Jones | -1.6% |
| Nasdaq Composite | -0.7% |
| Russell 2000 | -2.4% |
The Dow suffered its worst weekly performance since March, while the Russell 2000 experienced an even larger decline.
This difference is important for investors.
A single strong trading session does not automatically change the larger trend.
Friday’s market action should therefore be viewed as a strong rebound, rather than proof that all risks have disappeared.
AUGUST INFLATION REMAINS THE BIG FEDERAL RESERVE PROBLEM
The most important economic report released Friday was the August Consumer Price Index.
The Consumer Price Index, or CPI, measures changes in the prices consumers pay for goods and services.
According to the latest market reporting, U.S. consumer prices increased 0.4% in August from July and were 3.4% higher than a year earlier.
Core CPI, which excludes food and energy prices, increased approximately 0.3% for the month and 2.4% over the year.
For regular Americans, the message is straightforward:
Prices are still rising faster than the Federal Reserve wants.
The Fed’s long-term inflation goal is around 2%.
A 3.4% annual inflation rate is therefore still significantly above that target.
That creates a difficult environment for monetary policy.
WHY HIGHER OIL PRICES ARE SO IMPORTANT
Oil is not just another commodity.
It affects almost every part of the economy.
When crude oil becomes more expensive, consumers can eventually see higher prices for:
- Gasoline
- Diesel
- Air travel
- Shipping
- Food transportation
- Manufacturing
- Construction
- Delivery services
- Heating and energy
Companies also face higher operating costs.
A trucking company, for example, may pay more for diesel.
An airline may face higher fuel costs.
A delivery company may pay more to transport packages.
A manufacturer may face higher transportation and energy expenses.
Those higher costs can eventually be passed to consumers.
That is why the relationship between oil and inflation is so important for Wall Street.
MARKET CHAIN
Higher Oil → Higher Costs → Higher Inflation → Fed Pressure → Higher Rates → Stock Valuation Pressure
Friday temporarily interrupted that chain.
Oil prices fell.
That gave investors some relief.
THE FED RATE-HIKE STORY CHANGED THIS WEEK
One of the biggest developments on Friday was the sharp increase in expectations for a Federal Reserve rate hike.
Market-based expectations indicated roughly an 87% probability of a September rate increase, up from about 72% a day earlier, according to WSJ reporting.
The Federal Reserve’s policy decision is scheduled for September 16.
That means investors are entering the weekend with a much clearer expectation of what the central bank could do.
This is unusual because higher interest rates are normally negative for stock valuations.
So why did stocks rise?
Because markets had already been preparing for the possibility of higher rates.
The inflation report did not create an entirely new problem.
Instead, it gave investors more information.
Wall Street often reacts strongly when uncertainty is removed, even if the news itself is not particularly positive.
HIGHER INTEREST RATES ARE NOT AUTOMATICALLY BAD FOR STOCKS
A rate hike can hurt stocks.
But the effect depends on why the Fed is raising rates and what investors expect afterward.
If the Fed raises rates because inflation is out of control, investors may become nervous.
If the Fed raises rates because inflation is manageable but wants to keep expectations under control, the market reaction can be different.
The bigger issue is what happens to rates after the September meeting.
Investors will be watching for clues about:
- Future rate hikes
- Future rate cuts
- Inflation
- Economic growth
- Employment
- Oil prices
- Financial conditions
The Federal Reserve’s language could therefore be more important than the rate decision itself.
TREASURY YIELDS REMAIN A MAJOR WARNING SIGNAL
The bond market remains one of the biggest risks for Wall Street.
The U.S. Treasury’s official data showed the 10-year Treasury yield at about 4.96% on September 11, while the 30-year yield was about 5.35%.
Those are high borrowing costs by recent market standards.
The 10-year Treasury yield is especially important because it influences many financial products.
It can affect:
- Mortgage rates
- Corporate borrowing
- Consumer loans
- Bond prices
- Stock valuations
- Investment decisions
When Treasury yields rise, investors may demand better returns from stocks.
That can put pressure on expensive growth companies.
The technology sector is particularly sensitive because many technology companies are valued partly on expectations of future earnings.
Higher interest rates reduce the present value of those future earnings.
THE 5% TREASURY YIELD LINE MATTERS
The 10-year Treasury yield moved close to the psychologically important 5% level during the week.
Reuters reported that the 10-year yield reached nearly 4.98% before pulling back somewhat.
A sustained move above 5% could become an important market signal.
It could encourage some investors to move money from higher-risk stocks toward bonds.
That does not mean stocks would automatically crash.
But it could make it harder for highly valued stocks to continue rising.
Investors should therefore watch the 10-year Treasury yield as closely as they watch the S&P 500.
TECHNOLOGY STOCKS GET SOME RELIEF
Technology stocks were among the beneficiaries of Friday’s rebound.
The Nasdaq Composite gained 0.96%.
This was important because technology stocks had been under pressure as Treasury yields moved higher.
When yields stabilize or oil prices fall, investors may become more willing to buy growth stocks again.
Friday also brought strength in several large technology-related companies.
Strong corporate news helped support the broader technology complex, including gains related to Oracle’s results and other technology names.
However, investors should be careful about assuming that every technology stock will continue rising.
The sector still faces:
- High valuations
- High interest rates
- Large AI investment requirements
- Earnings expectations
- Competition
- Regulatory uncertainty
The long-term AI story remains powerful, but short-term stock prices can still move sharply.
SMALL-CAP STOCKS REMAIN THE WEAKER PART OF THE MARKET
The Russell 2000 gained only 0.45% on Friday.
That was weaker than the Dow, S&P 500 and Nasdaq.
More importantly, the Russell 2000 lost about 2.4% for the week.
This tells investors something important.
Small companies are often more sensitive to borrowing costs because they may depend more heavily on bank loans and other forms of financing.
When interest rates remain high, smaller businesses can face greater pressure.
Large technology companies may have strong balance sheets and large cash reserves.
A smaller company may not have the same financial flexibility.
That is one reason small-cap stocks can struggle when Treasury yields rise.
THE VIX FALLS AS MARKET FEAR EASES
The VIX volatility index ended Friday near 15.84, down more than 11%.
That was a significant one-day decline.
The VIX is often called Wall Street’s “fear gauge.”
It measures expected volatility in the S&P 500 based on options pricing.
A falling VIX generally means investors expect less near-term market turbulence.
Friday’s decline therefore showed that some of the immediate fear had disappeared.
But the VIX should not be interpreted as a guarantee of calm.
Oil remains elevated.
Treasury yields remain high.
The Fed meeting is approaching.
Geopolitical risks remain.
Therefore, volatility could return quickly.
OIL IS STILL THE MARKET’S BIGGEST WILDCARD
Friday’s oil decline was positive for stocks.
But oil remained above $100 per barrel for WTI and above $104 for Brent.
That is still an unusually high price environment.
Even more importantly, oil remained sharply higher for the week.
Reuters reported that oil prices were still about 9% higher for the week despite Friday’s decline.
This means investors should not assume that the inflation problem is over.
The market is still exposed to geopolitical developments affecting global energy supplies.
If crude oil rises again, the entire inflation discussion could quickly change.
THE WALL STREET OIL-INFLATION-FED CONNECTION
The current market can be understood through one simple chain:
OIL SHOCK
Oil prices rise.
↓
INFLATION PRESSURE
Gasoline, diesel, transportation and production costs increase.
↓
FED PRESSURE
The Federal Reserve becomes less comfortable with inflation.
↓
HIGHER INTEREST RATES
Markets price in fewer cuts or more hikes.
↓
TREASURY YIELDS RISE
Government bonds become more attractive relative to some stocks.
↓
STOCK VALUATIONS COME UNDER PRESSURE
Investors become more selective.
↓
MARKET VOLATILITY INCREASES
Technology and small-cap stocks can become more vulnerable.
This is why the direction of oil prices matters so much right now.
WHAT FRIDAY’S MARKET RALLY REALLY MEANS
The easiest way to describe Friday is:
Bullish for one day, but cautious for the bigger picture.
There were several positive signals.
POSITIVE SIGNALS
- Four-day losing streak ended
- S&P 500 gained 0.86%
- Nasdaq gained 0.96%
- Dow gained 0.98%
- VIX declined sharply
- Oil prices fell
- Technology stocks recovered
- Inflation did not surprise dramatically on the upside
But there were also warning signs.
WARNING SIGNALS
- Weekly market performance remained negative
- Dow lost 1.6% for the week
- Russell 2000 lost 2.4%
- Inflation remained above the Fed’s target
- Core inflation remained sticky
- 10-year Treasury yield stayed near 5%
- Oil remained above $100
- Fed rate-hike expectations increased
- Geopolitical risks remained high
This is why investors should avoid calling Friday a guaranteed new bull market.
WHAT INVESTORS SHOULD WATCH NEXT WEEK
The next week could be one of the most important periods of September.
The Federal Reserve meeting is the centerpiece.
But investors should also watch several other markets.
1. FEDERAL RESERVE
The market is increasingly expecting a rate hike.
The important question will be what Fed officials say about future policy.
2. OIL
WTI around $100 and Brent above $104 remain major inflation risks.
A move significantly higher could hurt stocks again.
3. 10-YEAR TREASURY YIELD
A sustained move toward or above 5% could increase pressure on stock valuations.
4. NASDAQ
The Nasdaq needs to demonstrate that Friday’s rebound can continue.
If technology stocks weaken again, the broader market could struggle.
5. RUSSELL 2000
Small caps are an important indicator of investor confidence in the broader economy.
Continued weakness would suggest that high borrowing costs remain a problem.
6. S&P 500
The S&P 500 closed at 7,656.98.
Investors will watch whether the index can hold the rebound or falls back toward recent lows.
SEPTEMBER 11 MARKET SCORECARD
| Factor | Market Signal | NYFT View |
|---|---|---|
| Dow Jones | Strong rebound | Bullish |
| S&P 500 | Strong rebound | Bullish |
| Nasdaq | Strong rebound | Bullish |
| Russell 2000 | Smaller gain | Cautious |
| Oil | Fell Friday | Positive |
| Inflation | Still elevated | Negative |
| Fed | Hike expectations rising | Negative |
| Treasury yields | Very high | Negative |
| VIX | Fell sharply | Positive |
| Geopolitical risk | Elevated | Negative |
| AI stocks | Recovering | Positive but selective |
| Overall market | Rebound | Cautiously bullish |
WHAT THIS MEANS FOR NEW INVESTORS
New investors should not try to predict every daily movement.
Friday’s market action is a good example of why.
On Thursday, rising oil prices and Treasury yields pushed stocks lower.
On Friday, oil prices fell and stocks rebounded.
The underlying economy did not completely change overnight.
Market expectations changed.
That is an important lesson.
For long-term investors, a one-day rally should not automatically change an investment strategy.
Instead, investors should focus on:
- Asset allocation
- Diversification
- Investment horizon
- Risk tolerance
- Company fundamentals
- Earnings
- Cash flow
- Debt
- Valuation
- Long-term economic trends
Investors should also avoid buying simply because the market has fallen for several days.
A falling market can continue falling.
Likewise, a rising market can continue rising.
WHAT THIS MEANS FOR TRADERS
Short-term traders face a different environment.
Oil, Treasury yields and Federal Reserve headlines can produce large intraday moves.
That means traders should be prepared for rapid changes in market direction.
A bullish opening does not guarantee a bullish close.
A strong morning can reverse after an inflation headline or Fed comment.
Risk management is therefore particularly important.
Traders should pay attention to:
S&P 500 futures → Treasury yields → crude oil → Nasdaq → VIX
These markets are currently closely connected.
THE BIG QUESTION: IS THE BULL MARKET STILL ALIVE?
The answer is complicated.
Yes, the broader U.S. equity market remains in a strong long-term position.
According to AP’s market summary, the major indexes remained positive for the year despite the difficult week. Through Friday, the Russell 2000 was up about 17% for the year, the Nasdaq about 13.3%, the S&P 500 about 11.9%, and the Dow about 9.4%.
That is important.
A difficult week does not automatically end a bull market.
However, the market is entering a more complicated phase.
Investors now have to balance strong corporate earnings and long-term technology growth against:
Inflation + Oil + Treasury Yields + Fed Policy + Geopolitical Risk
That combination can produce sharp swings.
WALL STREET’S CURRENT BALANCE
The market is currently balancing two very different stories.
THE BULL CASE
The U.S. economy remains resilient.
Corporate earnings remain important.
Technology and AI investment continue.
The major indexes remain positive for the year.
Friday showed that investors are still willing to buy stocks after weakness.
THE BEAR CASE
Inflation remains above the Fed’s target.
Oil prices remain extremely high.
Treasury yields are near multi-year highs.
Fed rate-hike expectations have increased.
Small-cap stocks are underperforming.
Geopolitical risks remain elevated.
Both stories are real.
That is why the market is volatile.
A SIMPLE GUIDE FOR AMERICAN INVESTORS
For regular American investors, the most important lesson from September 11 is not whether the Dow rises or falls tomorrow.
It is understanding how financial markets connect to everyday life.
If oil rises:
Gasoline can rise.
If inflation rises:
Household expenses can rise.
If the Fed raises rates:
Borrowing can become more expensive.
If Treasury yields rise:
Mortgage and corporate borrowing costs can remain elevated.
If corporate borrowing becomes expensive:
Companies may slow investment or hiring.
If earnings weaken:
Stock prices can come under pressure.
That is how Wall Street eventually connects to Main Street.
SEPTEMBER 11, 2026: FINAL NYFT MARKET VERDICT
Friday was a welcome relief for Wall Street.
The Dow gained 509 points.
The S&P 500 climbed 0.86%.
The Nasdaq rose 0.96%.
The Russell 2000 gained 0.45%.
Oil prices fell.
The VIX declined.
The four-day losing streak ended.
Those are all positive developments.
But the market still has major challenges.
Inflation remains above the Federal Reserve’s target.
Oil remains expensive.
Treasury yields remain high.
The probability of a Fed rate hike has increased sharply.
And the major indexes still finished the week lower.
The most important market message from September 11 is therefore:
Wall Street bounced, but the inflation battle is not over.
Investors should watch the relationship between oil, inflation, Treasury yields and Federal Reserve policy more closely than any single day’s stock-market move.
If oil continues to fall, inflation pressures could ease and stocks could receive another boost.
If oil rises again, the opposite could happen.
If Treasury yields move sustainably below recent highs, growth stocks could receive additional support.
If yields push above 5%, valuation pressure could return.
And if the Federal Reserve signals that the September rate hike is only the beginning of a more aggressive tightening cycle, markets could become much more defensive.
For now, the best description of Wall Street is:
CAUTIOUSLY BULLISH — BUT NOT RISK-FREE
Friday’s rally was real.
The risks are also real.
The next major test arrives with the Federal Reserve.
OFFICIAL DATA SOURCES
For readers who want to verify the underlying economic and Treasury data, NYFT recommends using primary U.S. government sources.
U.S. Bureau of Labor Statistics — Consumer Price Index: BLS CPI Data
U.S. Department of the Treasury — Daily Treasury Rates: U.S. Treasury Daily Rates
Federal Reserve: Federal Reserve Official Website
U.S. Securities and Exchange Commission — Investor Information: SEC Investor Information
IMPORTANT INVESTOR NOTE
This article is for news and educational purposes only. It is not personalized investment, financial, tax or trading advice. Market prices can change quickly, and investors can lose money. Readers should conduct their own research and consider their individual financial circumstances before making investment decisions.
NewYorkFinanceThink.com (NYFT) provides independent market analysis and news commentary based on publicly available information.
Yes — here is the ready-to-copy 50-source section for your NYFT WordPress article.
SOURCES AND REFERENCE WEBSITES
U.S. GOVERNMENT AND OFFICIAL SOURCES
- Federal Reserve: Federal Reserve
- Federal Reserve Economic Data (FRED): FRED
- U.S. Bureau of Labor Statistics: Bureau of Labor Statistics
- Consumer Price Index: BLS CPI
- U.S. Department of the Treasury: U.S. Treasury
- Treasury Interest Rates: Treasury Interest Rates
- Bureau of Economic Analysis: BEA
- U.S. Census Bureau: U.S. Census Bureau
- U.S. Securities and Exchange Commission: SEC
- Commodity Futures Trading Commission: CFTC
U.S. STOCK MARKET SOURCES
- New York Stock Exchange: NYSE
- Nasdaq: Nasdaq
- S&P Dow Jones Indices: S&P Dow Jones Indices
- Cboe Global Markets: Cboe Global Markets
- CME Group: CME Group
- Investor.gov: Investor.gov
- FINRA: FINRA
- MSCI: MSCI
- Energy Information Administration: EIA
- AAA Gas Prices: AAA Gas Prices
FINANCIAL NEWS SOURCES
- Reuters: Reuters
- Associated Press: Associated Press
- The Wall Street Journal: Wall Street Journal
- Bloomberg: Bloomberg
- CNBC: CNBC
- MarketWatch: MarketWatch
- Barron’s: Barron’s
- Financial Times: Financial Times
- Yahoo Finance: Yahoo Finance
- Investing.com: Investing.com
MARKET DATA AND TRADING SOURCES
- TradingView: TradingView
- StockCharts: StockCharts
- Morningstar: Morningstar
- Nasdaq Market Activity: Nasdaq Market Activity
- S&P 500: S&P 500 Index
- Dow Jones Industrial Average: Dow Jones Industrial Average
- Cboe VIX: Cboe VIX
- CME FedWatch: CME FedWatch Tool
- CME Markets: CME Markets
- Nasdaq Economic Calendar: Nasdaq Economic Calendar
OIL, ENERGY AND GLOBAL ECONOMY
- EIA Petroleum: EIA Petroleum Data
- OPEC: OPEC
- International Energy Agency: IEA
- World Bank: World Bank
- International Monetary Fund: IMF
- OECD: OECD
- EIA Short-Term Energy Outlook: EIA Short-Term Energy Outlook
- Federal Reserve Bank of New York: Federal Reserve Bank of New York
- Federal Reserve Bank of St. Louis: Federal Reserve Bank of St. Louis
- Federal Reserve Bank of Chicago: Federal Reserve Bank of Chicago
PRIMARY SOURCES FOR THIS ARTICLE
For the September 11, 2026 market report, the most important sources are BLS for inflation, U.S. Treasury for Treasury yields, Federal Reserve for monetary policy, EIA for energy data, CME for rate expectations, and Reuters/AP for market-session reporting.