
Dow Jones After a 0.61% Rally: What U.S. Investors Should Watch on September 18, 2026
Wall Street entered Friday, September 18, 2026, after a strong rebound in the previous session, but the Dow Jones Industrial Average gave back part of Thursday’s gains as Treasury yields moved higher and investors remained cautious about inflation, oil prices and Federal Reserve policy. The Dow closed Thursday, September 17, at 51,778.04, gaining 316.14 points, or 0.61%. The S&P 500 finished at 7,637.76, up 1.14%, while the Nasdaq Composite jumped 1.69% to 26,418.30. The Russell 2000 also gained about 0.6%. The rebound came after several difficult sessions for U.S. stocks, with easing oil prices and a decline in the 10-year Treasury yield helping investors return to risk assets.
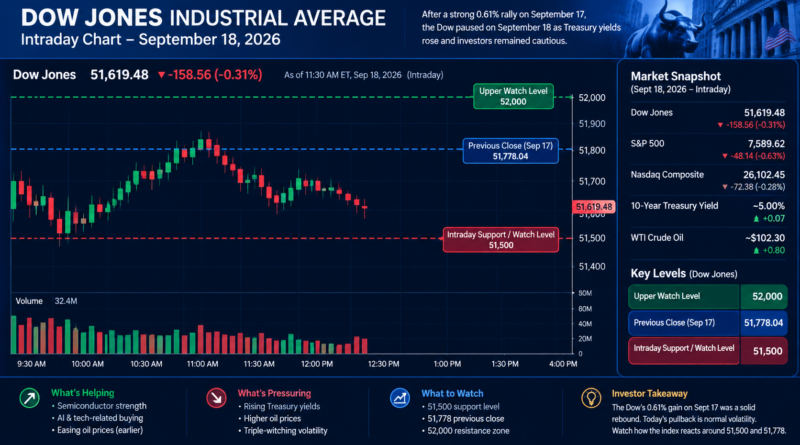
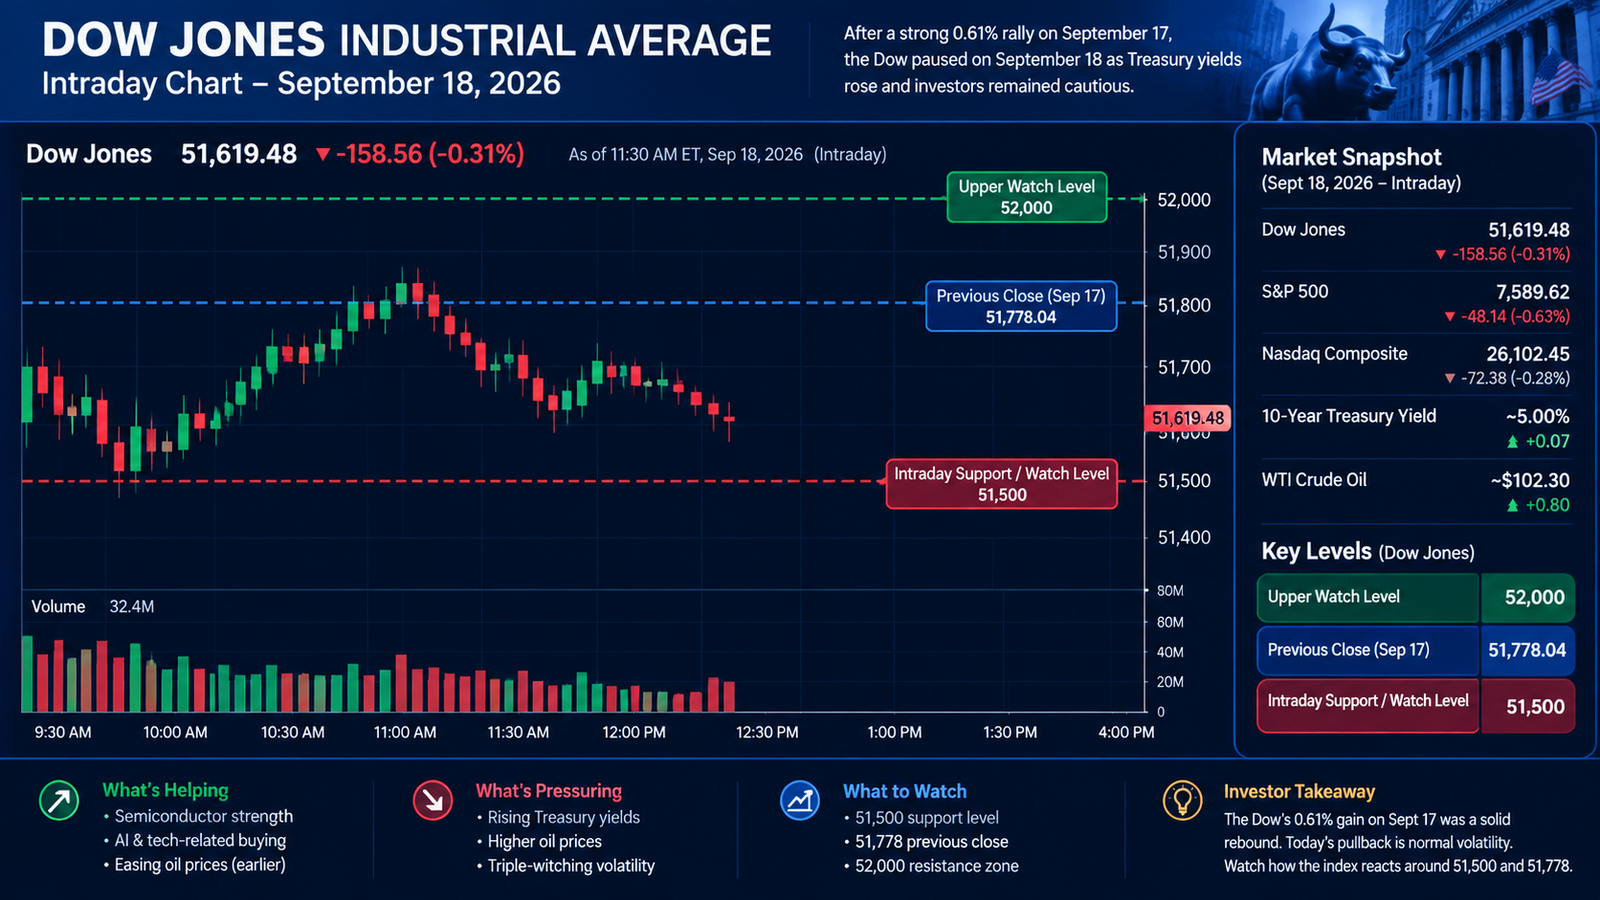
On Friday, however, the market picture changed. Early trading showed the Dow moving below Thursday’s close, with the index around the 51,500–51,700 area during the session. Yahoo Finance data showed the Dow at 51,550.72 at one point during morning trading, down about 0.44% from Thursday’s close. Intraday figures continued to change, making the exact level dependent on the time the market is checked.
Dow Jones Market Snapshot
| Market Indicator | September 17 Close | September 17 Change | September 18 Situation |
|---|---|---|---|
| Dow Jones | 51,778.04 | +316.14 (+0.61%) | Trading below previous close |
| S&P 500 | 7,637.76 | +1.14% | Under pressure |
| Nasdaq Composite | 26,418.30 | +1.69% | Mixed/volatile |
| Russell 2000 | — | +0.6% | Under pressure |
| 10-Year Treasury Yield | 4.93% | Lower Thursday | Around/above 5% Friday |
| WTI Crude Oil | Around $102 | Oil eased Thursday | Remains a market risk |
Thursday’s rally was broad enough to lift all three major U.S. indexes, but Friday’s trading showed why investors should not interpret one strong session as a guaranteed change in the broader trend. The Associated Press reported that the Dow gained 0.6% on Thursday, while the S&P 500 gained 1.1% and the Nasdaq rose 1.7%. The 10-year Treasury yield had fallen to 4.93% on Thursday, helping ease some pressure on stocks.
Why Did the Dow Rise 0.61% on Thursday?
The Thursday rally had several interconnected drivers. Oil prices had moved lower, reducing some of the immediate inflation pressure that had worried investors earlier in the week. At the same time, Treasury yields eased, which helped growth and technology shares recover. The Federal Reserve’s recent rate increase remained an important background issue, but investors appeared to focus more on the possibility that the central bank might not need to tighten policy as aggressively as previously feared.
The market had also experienced a sharp selloff earlier in the week. That created room for a technical rebound when some of the immediate pressure from oil and bond yields eased. The S&P 500, Dow and Nasdaq all recovered a significant portion of their earlier losses on Thursday.
Why Is the Dow Giving Back Some Gains Today?
The main issue on Friday is the bond market. Treasury yields moved higher again, with the 10-year yield reaching above 5% during the session according to market reports. Higher Treasury yields can make bonds more attractive relative to stocks and can also increase financing costs throughout the economy.
Reuters reported that rising Treasury yields were weighing on investor sentiment Friday. The report also noted that declining stocks outnumbered advancing stocks on both the NYSE and Nasdaq, showing that the pressure was not limited to one small group of companies.
Oil remains another important variable. When crude oil becomes more expensive, investors worry about higher gasoline, transportation and production costs. If higher energy prices feed into broader inflation, the Federal Reserve can face greater pressure to maintain restrictive monetary policy.
The 51,500 Level: Why Investors Are Watching It
For readers trying to understand today’s Dow action, 51,500 is a useful intraday reference area because the index traded near that level during Friday’s session. It should not be treated as a guaranteed technical support level. Markets can move through such levels quickly.
The more important question is whether buyers return if the Dow approaches the 51,500 area and whether the index can later recover toward Thursday’s 51,778.04 close.
A simple way to read today’s price action is:
Above 51,778: the market would be back above Thursday’s close.
Around 51,500: traders may watch for stabilization or another wave of selling.
Below 51,500: additional downside pressure could become more visible.
Above 51,800–52,000: a stronger recovery would become more evident, although it would still need confirmation from other market indexes and Treasury yields.
These are trading reference levels, not predictions or guaranteed support and resistance points.
What Does This Mean for an Average U.S. Investor?
For an American household with a 401(k), IRA or brokerage account, a 200-point move in the Dow can look dramatic on a financial-news screen. But the percentage move is often more useful than the point move.
The Dow moving from 51,778 to around 51,550 represents a decline of less than half a percent. That is very different from a major market breakdown. Investors should therefore look at the percentage change, the S&P 500, the Nasdaq and market breadth rather than judging the entire U.S. economy from the Dow’s point movement alone.
The Dow also contains only 30 large companies. It is therefore not a complete representation of every U.S. company or every sector. The S&P 500 provides a broader large-cap view, while the Nasdaq is more heavily influenced by technology and growth companies.
Technology Stocks Are Sending a Different Signal
One of the most important features of the current market is the difference between traditional blue-chip stocks and technology-related shares.
On Thursday, technology stocks helped lead the rebound. On Friday, semiconductor shares continued to show relative strength even as the broader market struggled. Reuters reported that the Philadelphia Semiconductor Index gained about 1.3%, helped by NVIDIA and Intel. Lam Research and Applied Materials were also among the stronger semiconductor-related names in Friday trading.
This matters because the market is not moving as one single group. Some investors are still buying companies connected to artificial intelligence, semiconductors and data-center infrastructure, while other areas remain sensitive to interest rates and oil prices.
Treasury Yields Are the Key Market Signal
For U.S. investors, the 10-year Treasury yield is one of the most important numbers to watch alongside the Dow.
When Treasury yields rise, investors reassess the relative attractiveness of stocks and bonds. Higher yields can also raise borrowing costs for businesses, consumers and the government. That can affect everything from corporate investment to mortgages and consumer financing.
The current move above the 5% level is therefore important for market psychology. Friday’s stock weakness occurred as Treasury yields moved higher, reinforcing the relationship between the bond market and equities.
Oil Prices Remain a Major Risk
Crude oil is another major piece of the market puzzle.
Oil prices had fallen during Thursday’s rebound, helping stocks recover. But oil moved higher again Friday, with WTI trading around the $102 area during the session. Rising oil prices can increase inflation expectations because energy costs affect transportation, manufacturing and household spending.
For ordinary Americans, the connection is straightforward. More expensive crude can eventually mean higher gasoline prices, higher transportation costs and higher costs for companies that depend heavily on energy.
That does not automatically mean inflation will rise every time oil rises. The duration of the oil move, supply conditions and the response of other prices all matter.
Triple Witching Can Make Friday More Volatile
September 18 is also an important derivatives-expiration session. Market reports described Friday as a triple-witching day, when several categories of stock and index derivatives expire. Such sessions can produce heavier trading activity and larger intraday movements.
Charles Schwab noted that trading activity and volatility could be above normal because of triple witching.
For individual investors, that means a sudden move during the trading day should not automatically be interpreted as a fundamental change in the economy. Some price movement can come from positioning and derivatives expiration.
Dow Jones Trading Picture
51,461.90
⬆
51,778.04
+316.14 | +0.61%
51,778.04 previous close
⬇
~51,500–51,700 intraday area
Market remains volatile
The Dow’s recent history also shows why the current move needs context. The index closed at 52,093.11 on September 15, fell to 51,461.90 on September 16, then rebounded to 51,778.04 on September 17. This means the Thursday rally recovered only part of the decline from earlier in the week.
What Should U.S. Investors Watch Next?
The most important indicators are not simply whether the Dow finishes green or red. Investors should watch the relationship between stocks, Treasury yields and crude oil.
If Treasury yields continue rising while oil remains above $100, stocks could remain sensitive to inflation and interest-rate expectations. If oil moves lower and Treasury yields stabilize, pressure on equities could ease.
The semiconductor sector is another important signal. Continued strength in chip stocks would show that investors are still willing to put money into AI and technology infrastructure even while the broader market is cautious.
Investors should also watch market breadth. If the Dow rises but only a small group of stocks participates, the move is less broad than a rally in which many sectors advance together.
What 51,778 Means Today
The previous close of 51,778.04 is the most useful reference point for understanding today’s Dow action.
If the Dow remains below that level, Thursday’s rally has not yet been fully extended into Friday trading. If the index moves back above it and holds there, investors would have evidence that buyers are returning after the early weakness.
The 51,500 area is another important reference because Friday’s trading has moved close to that level. But neither level should be viewed as a guaranteed turning point.
The market can move sharply in either direction when Treasury yields, oil prices and derivatives positioning are changing simultaneously.
Bottom Line for U.S. Readers
The Dow’s 0.61% gain on September 17 was a genuine one-day rebound, but Friday’s action shows that investors are still dealing with several unresolved issues. The market is balancing higher oil prices, Treasury yields around the 5% area, Federal Reserve policy and continued strength in parts of the technology and semiconductor sectors.
For an average U.S. investor, the important lesson is not to focus on a single Dow point move. A better approach is to watch the Dow together with the S&P 500, Nasdaq, Treasury yields, crude oil and market breadth.
As of September 18, the key Dow reference points are 51,778.04 from Thursday’s close and roughly 51,500 as an intraday area being watched today. Whether buyers can recover the previous close, or whether selling pressure pushes the index below the day’s lower levels, will provide a clearer picture of short-term market sentiment.
The market remains fluid, and an intraday number should not be treated as a prediction of where the Dow will finish the day.
Sources
- Reuters — Wall Street Market Update, September 18, 2026
- Associated Press — U.S. Stock Market Performance, September 17, 2026
- Yahoo Finance — Dow Jones Industrial Average Historical Data
- Charles Schwab — U.S. Market Update, September 18, 2026
- Upstox — U.S. Stock Market and Dow Jones Market Data
Direct source links:
