Dow Jones Today Live: US Stocks Fall as Inflation Concerns and Corporate Earnings Pressure Wall Street — October 29, 2026
The Dow Jones Industrial Average came under pressure on Thursday, October 29, as investors weighed fresh inflation concerns, corporate earnings results and the outlook for US interest rates. After Wall Street finished the previous session higher, the mood became more cautious as traders returned their attention to the cost of borrowing and the ability of major American companies to meet market expectations.
The latest available intraday report showed the Dow trading around 52,339, down approximately 0.20% from Wednesday’s close of 52,475.10. The S&P 500 was also lower, while the technology-heavy Nasdaq faced stronger selling pressure. These figures represent an intraday snapshot rather than the final closing prices for October 29.
The change in sentiment is a reminder that stock markets can move quickly when economic data and company results challenge investors’ expectations. Even when the Federal Reserve leaves interest rates unchanged, the market can react negatively if investors believe inflation will remain too high or that borrowing costs may rise again.
For everyday investors, the important question is not simply whether the Dow is rising or falling. It is why the market is moving, which sectors are influencing the index, and what the latest developments could mean for the wider US economy.
In this Dow Jones market analysis, we examine the latest reported market levels, inflation concerns, the Federal Reserve’s position, corporate earnings, oil prices, and the economic signals investors should monitor next.
Dow Jones Market Snapshot: October 29, 2026
The latest available reports point to a cautious start to Thursday’s trading session.
- Dow Jones Industrial Average: approximately 52,339, down around 0.20% in the reported morning snapshot.
- Previous Dow Jones close: 52,475.10 on October 28.
- S&P 500: approximately 7,716 in the reported intraday snapshot, down around 0.35%.
- Nasdaq 100: under pressure, with the index falling more sharply than the Dow in the reported early session.
- Main market concerns: inflation, potential Federal Reserve rate increases, corporate earnings and technology-sector weakness.
These figures are time-sensitive. The Dow Jones is a live index during US trading hours, and its value can change from minute to minute. Readers should check a live market-data provider for the latest quote and the official closing level before making any financial decision.
Wednesday’s session had ended on a stronger note. The Dow closed at 52,475.10, gaining approximately 0.19%, while the S&P 500 advanced 0.28% to 7,743.98. The Nasdaq Composite rose 0.27% to 26,549.85.
Thursday’s weakness therefore came after a positive session, showing how quickly investor sentiment can change when new information arrives.
Why Is the Dow Jones Falling Today?
Several factors are influencing the market on October 29. Inflation is once again a central concern, corporate earnings have produced mixed reactions, and investors are reconsidering how much room the Federal Reserve has to change interest rates.
1. Inflation Is Back in Focus
Inflation remains one of the most important issues for the US stock market. When consumer prices rise faster than expected, the Federal Reserve may need to keep interest rates high for longer or consider tightening monetary policy.
Reports on Thursday pointed to stronger-than-expected inflation data, increasing concern about the possibility of another rate increase at a future Federal Reserve meeting.
For investors, the issue is straightforward. Higher inflation can increase household expenses, raise operating costs for businesses and reduce the likelihood of near-term interest-rate relief.
Companies may find it more expensive to pay employees, transport goods, purchase materials and finance expansion. Some businesses can pass higher costs on to customers, but others may have to accept lower profit margins.
This uncertainty can affect share prices even when a company’s underlying business remains healthy.
Investors therefore pay close attention to inflation reports, especially measures that influence the Federal Reserve’s decisions. One important measure is the Personal Consumption Expenditures price index, commonly known as the PCE price index.
The PCE index helps policymakers assess changes in the prices consumers pay for goods and services. Its core measure excludes food and energy prices to provide a clearer view of underlying inflation trends.
A hotter-than-expected inflation report does not automatically guarantee a rate increase. Policymakers examine a range of economic indicators, including employment, consumer spending, productivity and the persistence of price pressures.
However, if inflation remains elevated, investors may reduce expectations for interest-rate cuts and begin preparing for borrowing costs to stay high for longer.
That possibility can create pressure across the stock market.
2. The Federal Reserve’s Interest-Rate Decision
The Federal Reserve kept its benchmark interest-rate target unchanged at 3.75% to 4% following its October 28 meeting, according to published market reports.
At first glance, leaving rates unchanged might appear positive for stocks. Investors generally prefer stable borrowing costs because businesses can plan investment, hiring and expansion with greater certainty.
But a decision to hold rates steady does not necessarily mean that monetary policy will become easier.
The central bank must balance two competing objectives: supporting a healthy economy and bringing inflation back toward its longer-term target.
If inflation remains too high, the Federal Reserve may decide that lowering interest rates would be premature. If price pressures increase further, policymakers may even consider raising rates again.
This uncertainty is particularly important for the Dow Jones because the index includes companies from several industries, including financial services, healthcare, industrials and consumer businesses.
Higher interest rates can affect each of these sectors differently.
Banks may benefit from certain interest-rate conditions, depending on their lending and deposit costs. Highly indebted businesses may face greater financing expenses. Consumer-focused companies can also experience weaker demand if households spend more of their income on borrowing costs.
The Federal Reserve’s next decisions will depend on incoming data rather than a fixed promise to raise or lower rates.
Investors should therefore avoid assuming that an unchanged rate automatically signals a bullish market.
3. Corporate Earnings Are Creating Uneven Results
Corporate earnings season is another major influence on the Dow Jones.
When companies report quarterly results, investors examine more than their headline profits. They also look at revenue growth, operating expenses, cash flow, management forecasts and expectations for the coming quarters.
A company can report higher sales and still see its share price decline if its profit falls short of expectations. Similarly, a business that reports modest growth may see its stock rise if investors had expected much worse results.
This explains why earnings announcements can produce large moves in individual stocks.
Thursday’s reports brought renewed attention to Alphabet and Caterpillar, among other companies. MarketWatch reported that declines in Alphabet and Caterpillar contributed significantly to the Dow’s early losses.
For the broader market, the reaction highlights a key issue: investors want to see that companies can convert revenue growth into sustainable profits.
Businesses face a range of challenges, including labour costs, financing expenses, global competition, technology investment and changing consumer demand.
Investors will continue to compare actual results with expectations rather than judge companies on revenue or profit figures alone.
4. Technology Weakness Is Affecting Market Sentiment
Technology shares have become a major focus for investors because of the enormous amount of money being invested in artificial intelligence, cloud computing, data centres and semiconductor infrastructure.
These investments may support long-term growth, but they also require significant spending.
Investors want to know whether that spending will eventually generate enough revenue and profit to justify the cost.
If companies increase their investment budgets while earnings disappoint, shareholders may become less willing to pay premium valuations.
This concern has placed additional attention on major technology companies and their earnings guidance.
The Dow Jones is not as technology-heavy as the Nasdaq Composite, but technology companies still influence its performance. Large moves in a few index constituents can affect the headline number, especially when those companies have substantial weight within the index.
Investors should also remember that a decline in the Nasdaq does not mean every technology stock is falling. Different companies have different financial positions, growth prospects and valuations.
The same principle applies to the Dow: the index can decline even when many individual stocks remain stable or advance.
Understanding the Dow Jones Industrial Average
The Dow Jones Industrial Average is one of the best-known measures of the US stock market. It tracks 30 major publicly traded American companies across a variety of industries.
The index is often used as a quick indicator of sentiment toward established US businesses.
However, the Dow does not represent the entire stock market. It is a selected group of companies rather than a comprehensive measure of every publicly traded business.
The Dow is also price-weighted. This means that a company’s share price influences its contribution to the index differently from how market capitalisation would influence a market-cap-weighted index.
As a result, a large percentage move in a high-priced Dow component can have a meaningful effect on the index, even if that company is smaller by total market value than another constituent.
This is important when interpreting daily market reports.
If the Dow falls sharply, investors should check which companies contributed most to the decline. The headline index movement alone does not explain whether the weakness was broad-based or concentrated in a handful of stocks.
The Dow is most useful when considered alongside other indicators, including the S&P 500, Nasdaq Composite, Russell 2000, Treasury yields and sector performance.
Together, these measures can provide a more complete picture of market conditions.
Dow Jones Versus the S&P 500 and Nasdaq
The Dow Jones, S&P 500 and Nasdaq Composite often move in the same direction, but their performance can differ considerably.
The Dow follows 30 selected blue-chip companies. The S&P 500 covers a much broader group of large US companies, while the Nasdaq Composite includes thousands of companies listed on the Nasdaq exchange and has substantial exposure to technology and growth stocks.
These differences help explain why the Nasdaq can fall more sharply than the Dow during periods of pressure on technology shares.
Technology and growth companies may be particularly sensitive to changes in interest-rate expectations because their valuations often depend on anticipated future earnings.
When investors demand a higher return to compensate for risk, the present value of those future earnings can decline.
The Dow may be more resilient in some circumstances because it includes companies from several industries. However, it is not immune to market-wide selling or pressure on major constituents.
The S&P 500 provides another useful comparison because of its broader representation of large US businesses.
Investors who see the Dow falling should therefore compare its movement with the other indexes before concluding that the entire market is experiencing the same degree of weakness.
A divergence between the indexes can reveal which sectors investors are favouring or avoiding.
How Interest Rates Affect Stocks
Interest rates influence the stock market through several channels.
First, they affect the cost of borrowing. Businesses may postpone expansion when financing becomes more expensive, while households may reduce spending if loan and credit costs rise.
Second, interest rates affect the returns investors can obtain from relatively lower-risk assets such as government bonds. When bond yields rise, some investors may become less willing to pay high valuations for shares.
Third, interest rates influence how investors value future corporate earnings.
Consider a company expected to generate strong profits over the next decade. If market interest rates rise, investors may apply a higher discount rate to those future earnings. That can reduce the value they are willing to pay for the company’s stock today.
This does not mean that all stocks fall whenever rates rise. Financial institutions, energy businesses and companies with strong cash generation may respond differently from highly valued growth companies.
The economic context matters as well. If rates rise because the economy is growing strongly, some businesses may benefit from healthy demand. If rates rise because inflation is proving difficult to control, the market reaction may be less positive.
Investors should look at both the reason for a rate move and its likely consequences for company earnings.
What Higher Inflation Means for American Households
Stock market movements can feel distant from everyday life, but inflation and interest rates have direct consequences for households.
When food, housing, transport, healthcare and utility costs increase, families may have less money available for discretionary spending.
That can affect retailers, restaurants, travel businesses and other companies that depend on consumer demand.
Higher borrowing costs can also influence mortgage payments, credit card balances, auto loans and business financing.
For households with variable-rate debt, changes in borrowing costs may place additional pressure on monthly budgets. Even people with fixed-rate loans can feel the effects when they need to refinance or take out new credit.
This connection between household finances and corporate earnings helps explain why investors monitor economic indicators so closely.
If consumers become more cautious, businesses may see slower sales. If companies respond by reducing investment or hiring, economic growth may weaken further.
However, the relationship is not immediate or uniform. Some businesses serve customers who are less sensitive to price changes, while others can protect margins through productivity improvements or pricing power.
A single inflation report cannot predict the future direction of the economy. Investors need to consider the broader trend across several months of data.
Why Corporate Guidance Matters as Much as Profits
Quarterly earnings announcements often receive substantial media attention, but management guidance can be equally important.
Guidance refers to a company’s outlook for future revenue, profits, spending or other business measures.
Investors use these forecasts to assess whether a company is likely to meet expectations in the coming months and years.
A business may report strong quarterly earnings but issue a cautious outlook because demand is weakening or costs are rising. Its stock may fall despite the positive historical results.
Conversely, a company that misses one quarterly target may see its shares recover if management provides credible evidence that future performance will improve.
In the current environment, investors are paying particular attention to capital expenditure, including spending on artificial intelligence and data-centre infrastructure.
These investments can create long-term opportunities, but they can also reduce near-term free cash flow.
The important question is whether future returns are likely to justify the amount being invested.
Investors should look for evidence of growing customer demand, improving margins, sustainable cash generation and realistic financial targets.
A company’s investment plans should be assessed in the context of its balance sheet and business model rather than judged by their size alone.
What Investors Should Watch Next
Several developments could influence the Dow Jones during the remainder of the week and beyond.
Inflation and economic releases
The next round of inflation and economic data may change expectations for Federal Reserve policy.
Investors should compare actual readings with forecasts and examine whether price pressures are broad-based or concentrated in specific categories.
A single report can cause volatility, but a consistent trend is generally more informative.
Federal Reserve commentary
Statements from policymakers may provide clues about how the central bank views inflation, economic growth and the labour market.
However, investors should avoid interpreting individual comments as a guaranteed forecast of the next interest-rate decision.
The Federal Reserve’s policy path can change as new evidence becomes available.
Corporate earnings
Company reports and guidance will remain important as investors evaluate the health of American businesses.
Attention may focus on revenue growth, profit margins, cash flow, consumer demand, capital expenditure and forecasts for the next quarter.
Results from large companies can also influence market sentiment beyond their own industries.
Treasury yields
US Treasury yields provide a useful indication of market expectations for interest rates, inflation and economic conditions.
Rising yields can put pressure on some stock valuations, although the effect depends on why yields are moving.
Investors should compare movements in short-term and long-term yields rather than focus on one number in isolation.
Oil prices and geopolitical developments
Oil prices can affect inflation expectations, transportation costs and corporate expenses.
A sustained increase in energy prices may place additional pressure on households and businesses. At the same time, energy producers can respond differently from companies that depend on fuel as a major input.
Geopolitical developments can also change supply expectations and risk sentiment quickly.
These factors do not determine the Dow’s direction by themselves, but they can add to market volatility when investors are already uncertain.
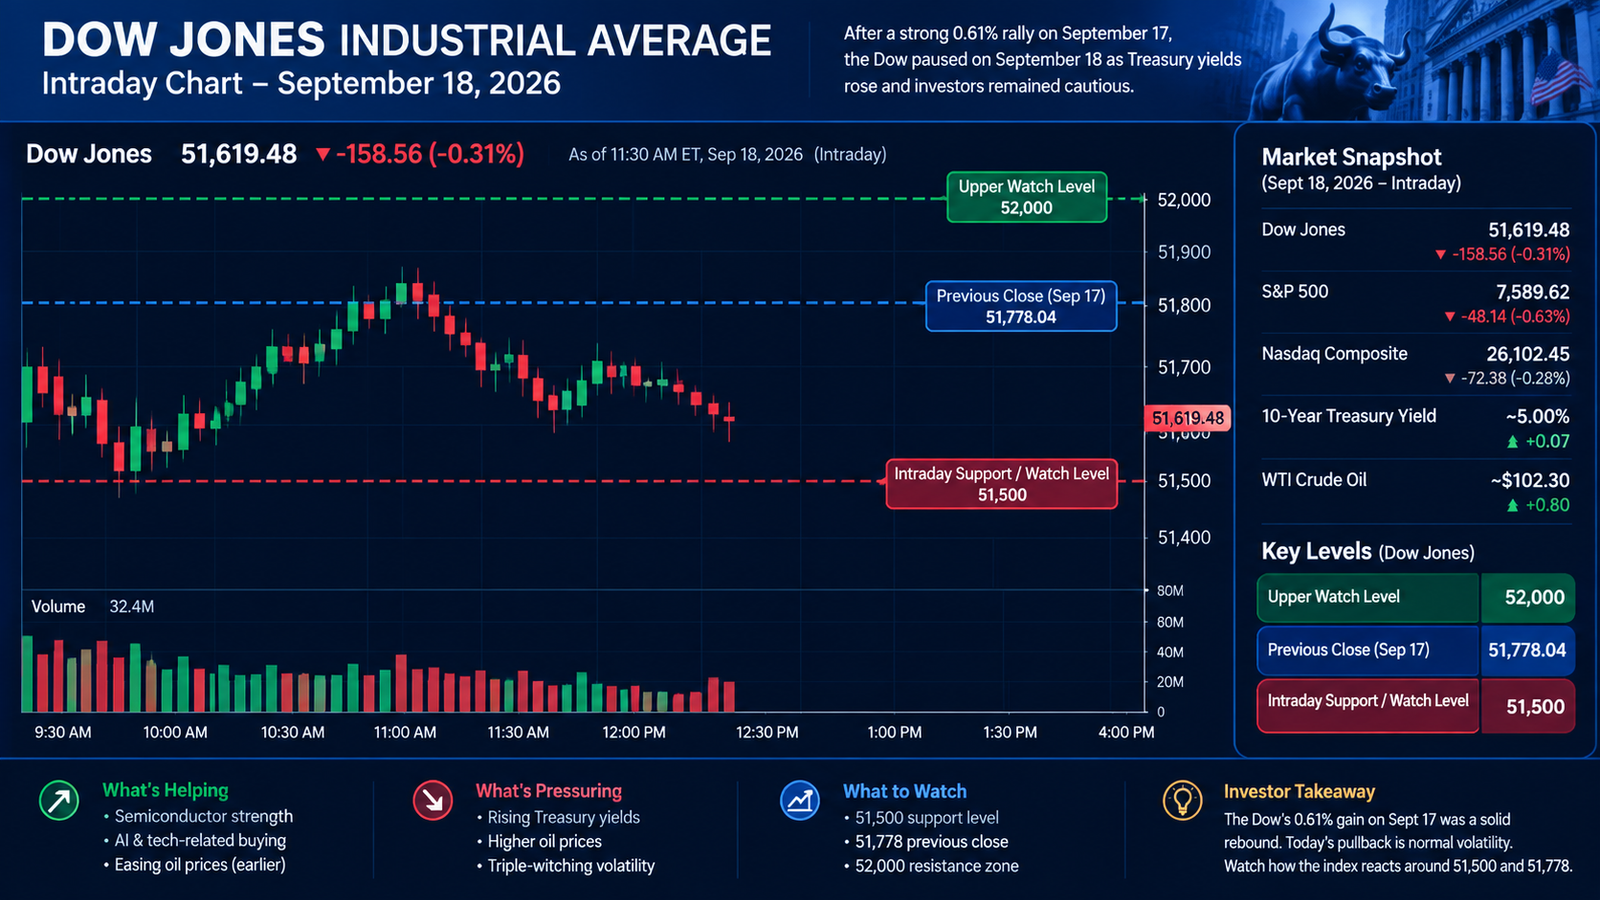
Dow Jones Technical Analysis: What the Index Chart Can Tell You
Technical analysis examines historical prices, trading ranges and chart patterns to understand how buyers and sellers have behaved.
It can help investors organise market information, but it cannot guarantee the next move.
For the Dow Jones, traders often examine recent highs and lows, moving averages, trading volume and price levels where the index previously found support or encountered selling pressure.
Support levels
Support is an area where buying interest has previously been strong enough to slow or interrupt a decline.
If the Dow approaches a previous support area, traders may watch to see whether buyers return.
However, support is not a guaranteed floor. If selling pressure remains strong, the index can move below it.
Resistance levels
Resistance is an area where selling has previously limited an advance.
If the Dow approaches resistance, traders may look for evidence of stronger buying or a rejection of higher prices.
A convincing move above resistance can indicate improving momentum, but false breakouts are possible.
Moving averages
Moving averages smooth price movements over a chosen period.
Some traders monitor the 50-day and 200-day moving averages to assess medium- and longer-term trends.
When the index trades above a rising moving average, the broader trend may be constructive. When it trades below a falling average, investors may become more cautious.
These indicators should be used alongside other evidence rather than as standalone buy or sell signals.
Trading volume and market breadth
Trading volume measures how many shares are exchanged, while market breadth looks at how many stocks are advancing compared with those declining.
These measures can help investors judge whether a market move is broad or concentrated.
For example, a falling Dow accompanied by widespread declines may indicate broader risk aversion. If only a few large components account for most of the weakness, the headline index may exaggerate the extent of the selling across the wider market.
Because this article does not establish verified intraday chart levels, specific support and resistance prices should be taken from an updated Dow Jones chart before publication.
Is the Dow Jones Market in Trouble?
A decline during one trading session does not automatically mean the market is entering a prolonged downturn.
Stock indexes regularly experience pullbacks as investors react to earnings, economic data, interest rates and changing expectations.
The more important question is whether the decline reflects a temporary adjustment or a sustained deterioration in the underlying outlook.
Investors can examine several factors when assessing the situation.
Are corporate earnings estimates being revised lower across many industries? Is unemployment rising? Are consumer spending and business investment weakening? Are credit conditions becoming tighter? Are more stocks falling than rising over several sessions?
If several of these indicators deteriorate together, market weakness may deserve closer attention.
If the economy remains resilient and company earnings continue to grow, a short-term pullback may instead reflect changing valuations or profit-taking.
No single indicator can settle the question. Market analysis is most useful when it combines economic data, company fundamentals, valuations and price behaviour.
Three Possible Scenarios for the Dow Jones
The Dow’s next move will depend on how economic information and corporate results develop. Rather than assume a single outcome, investors can consider three broad scenarios.
Scenario 1: The market stabilises
The Dow could stabilise if investors conclude that recent inflation concerns will not force a substantial change in Federal Reserve policy.
Stronger corporate guidance, improving market breadth or easing bond yields could also help confidence recover.
In this scenario, investors might return to companies with solid balance sheets, consistent earnings and reasonable valuations.
Stabilisation would not necessarily mean that the index immediately reaches a new high. It could simply mean that selling slows and prices begin to move within a narrower range.
Scenario 2: Volatility continues
The market may remain volatile if economic data sends mixed signals.
For example, strong consumer demand could support company revenue while persistent inflation keeps interest-rate expectations elevated.
Corporate earnings could also produce uneven results, with some businesses beating forecasts and others warning about rising costs.
Under this scenario, investors may become more selective. Individual company results and management guidance could matter more than broad market optimism.
Scenario 3: Selling pressure increases
The Dow could face further pressure if inflation remains stubborn, Treasury yields rise sharply or corporate earnings disappoint across several industries.
A sustained increase in borrowing costs could weigh on investment, consumer spending and stock valuations.
Weak market breadth could also indicate that selling is spreading beyond a small group of companies.
This scenario is a risk to monitor, not a prediction. It would need confirmation from fresh economic data, market prices and company reports.
Investors should avoid making major financial decisions based only on one day’s market movement or a hypothetical scenario.
What Should Beginner Investors Do During Market Volatility?
Market volatility can be uncomfortable, especially for people who are new to investing.
The temptation is to react immediately to every headline. But frequent decisions based on short-term market movements can lead to mistakes.
A more disciplined approach starts with understanding the purpose of an investment.
Someone saving for a goal many years away may have a different strategy from someone who needs the money within the next year.
Time horizon, financial circumstances, risk tolerance and diversification all influence how a person should respond to market changes.
Avoid decisions based on headlines alone
A headline stating that the Dow has fallen does not explain the full market picture.
Before acting, investors should identify what caused the decline, whether the information changes their long-term investment case and whether the market has already reflected the news in prices.
Understand diversification
Diversification means spreading investments across different assets, companies, industries or regions rather than depending on a single investment.
It does not eliminate losses, but it can reduce the impact of a problem affecting one company or sector.
Keep emergency savings separate
Money needed for rent, bills, debt payments or unexpected expenses generally should not depend on the daily performance of the stock market.
Having an appropriate emergency reserve can reduce the pressure to sell investments during a downturn.
Review risk rather than chase predictions
No analyst can reliably predict every market move.
Instead of trying to identify the exact bottom or top, investors can review their portfolio’s risk, costs, diversification and suitability for their goals.
Anyone who is uncertain about their personal circumstances may benefit from consulting a qualified financial professional.
How the Dow Jones Affects the Wider US Economy
The Dow Jones is a market indicator, not a direct measurement of the economy.
A rising index does not necessarily mean that every household is better off. Similarly, a falling index does not automatically mean the economy is in recession.
Stock prices reflect expectations about future profits, interest rates, risk and investor demand. Economic indicators measure different things, including employment, production, consumer prices and spending.
The two are connected, but they do not always move together.
For example, stock prices can rise when investors expect interest rates to fall, even if the economy is slowing. Markets can also decline during a period of economic growth if investors believe company valuations have become too high.
The Dow can nevertheless influence public confidence and financial conditions.
When stock prices rise, households with investments may feel wealthier, and companies may find it easier to raise capital. When prices fall sharply, investors may become more cautious and businesses may reconsider spending plans.
These effects vary across households and companies, depending on how much they rely on financial markets.
The Dow should therefore be viewed as one useful piece of information within a much larger economic picture.
The Difference Between a Market Correction and a Crash
Investors sometimes describe any sharp daily decline as a market crash, but the terms are not interchangeable.
A correction is commonly used to describe a decline of about 10% from a recent market peak. A bear market is commonly associated with a decline of 20% or more from a recent peak. These are widely used conventions rather than universal rules.
A crash usually refers to an unusually rapid and severe decline, often accompanied by widespread panic or disruption.
A one-day loss of a few tenths of a percentage point does not, by itself, meet these commonly used definitions.
Understanding the difference can help readers avoid overstating market developments.
When writing about the Dow Jones, it is more accurate to report the actual percentage change, explain the main drivers and compare the move with recent performance.
If the index experiences a much larger decline, the article should explain the scale and context using verified data.
Why the Dow Can Fall Even When Many Stocks Rise
Because the Dow is price-weighted, its performance can be heavily influenced by certain constituents.
This means the index may fall even if a large number of individual stocks are unchanged or higher.
The reverse is also possible: a few influential components can lift the index even when many other stocks decline.
This is why market breadth matters.
Investors can examine the number of advancing and declining stocks, sector performance and the contribution of individual Dow components to understand the character of a market move.
For example, a sharp fall in a major component can have a noticeable effect on the index. If several influential companies decline together, their combined effect may outweigh gains elsewhere.
Readers should therefore avoid interpreting the Dow’s daily percentage change as a complete account of every American company’s performance.
Why Investors Follow the Dow Jones Every Day
The Dow remains popular because it provides a familiar snapshot of several major US businesses.
Financial news organisations use it to explain market sentiment, while investors monitor it alongside other indexes and economic indicators.
Its long history also makes it useful for discussing major market events and long-term trends.
However, the Dow has limitations. It contains only 30 companies, and its price-weighted structure differs from the market-cap-weighted approach used by many other indexes.
People who want a broader view of large US companies often examine the S&P 500 as well. Those interested in technology and growth stocks may also follow the Nasdaq Composite or Nasdaq-100.
Using several measures can help investors avoid drawing conclusions from one index alone.
Frequently Asked Questions
What is the Dow Jones today, October 29, 2026?
The latest available intraday report cited in this article placed the Dow Jones Industrial Average around 52,339, approximately 0.20% below its previous close of 52,475.10. This is a time-specific snapshot, not the final October 29 closing value. Check a live market-data provider for the current quote.
Why is the Dow Jones falling today?
Thursday’s reported weakness was associated with renewed inflation concerns, uncertainty about future Federal Reserve policy and disappointing results from some major companies. Individual stocks can also have an outsized effect on the Dow because it is price-weighted.
Did the Federal Reserve change interest rates?
Published reports said the Federal Reserve held its benchmark interest-rate target at 3.75% to 4% on October 28, 2026. Investors remained focused on inflation and the possibility that policy could change at a future meeting.
Is the Dow Jones a good indicator of the US economy?
The Dow is a useful indicator of sentiment toward selected large US companies, but it does not measure the entire economy. Employment, inflation, consumer spending, industrial production and other indicators are also important.
What is the difference between the Dow Jones and the Nasdaq?
The Dow tracks 30 selected major US companies and is price-weighted. The Nasdaq Composite includes thousands of companies listed on the Nasdaq exchange and has substantial technology exposure. Their daily performance can differ because of their different compositions.
Should I buy stocks when the Dow falls?
A market decline alone is not enough to determine whether a stock is a good purchase. Investors should consider company fundamentals, valuation, diversification, risk tolerance and investment goals. This article does not provide personalised investment advice.
Where can I check the Dow Jones live?
You can check the Dow Jones using Yahoo Finance, Google Finance, CNBC or other reputable financial data providers. Confirm whether the quote is live, delayed or based on the previous session’s close.
Final Outlook: What Comes Next for Wall Street?
The Dow Jones entered Thursday’s session facing a more difficult backdrop than it had the previous day. Inflation concerns, uncertainty about the Federal Reserve’s next move and mixed corporate earnings have reminded investors that a positive market session does not guarantee continued gains.
The most important signals to monitor are the next inflation readings, Treasury yields, company earnings guidance and the breadth of market movements.
If inflation moderates and corporate profits remain resilient, market sentiment could improve. If inflation stays elevated and borrowing costs rise, stocks may face additional pressure. Mixed economic information could also keep markets volatile.
For everyday readers, the best way to understand the Dow is to look beyond the headline number. Ask what is moving the market, which companies are influencing the index, and whether new information changes the economic outlook.
Market forecasts are uncertain, and a single trading session rarely provides a complete answer. Reliable data, a broader economic perspective and careful risk management are more useful than reacting to every market headline.
Sources and further reading
- Dow Jones and broader US market news: https://www.reuters.com/markets/
- Yahoo Finance market updates: https://finance.yahoo.com/markets/
- CNBC markets: https://www.cnbc.com/markets/
- MarketWatch market coverage: https://www.marketwatch.com/
- Associated Press market reports: https://apnews.com/hub/stock-markets
- Federal Reserve monetary policy information: https://www.federalreserve.gov/monetarypolicy.htm
Disclaimer: This article is intended for general informational and educational purposes only. It is not investment, financial, tax or legal advice. Market prices and economic conditions can change quickly. Verify the latest figures and consult a qualified financial professional when appropriate.